14
LouisianaExport Guide
2015-2016
L
ouisiana’s2014worldwidemerchandiseexports increased
by2.8percentover2013, according toa reportby the
WorldTradeCenterofNewOrleans.
For the year, Louisiana exports totaled $65.1 billion, com-
pared to $63.3 billion in 2013, and $62.8 billion in 2012.
These numbersmark the sixth consecutive year of export
growth for the state. Louisiana’s principal exportmarkets
for 2014were China ($8.7 billion, up 8.9 percent),Mexico
($7.3 billion, up 14.5 percent), andCanada ($3.3 billion, up
5.6 percent), followed by theNetherlands, Japan, Colombia,
and France.
Roundingout the top10wereBrazil, Egypt, andPanama.
Exports forall 50StatesandPuertoRico, theU.S. Virgin Islands,
and theDistrictofColumbia set aanotherannual record in
2014, totaling$1.62 trillion, a2.8percent increaseover2013.
Louisiana ranked6thamongU.S. states, the same ranking it
held in2013. Ingeneral the top10exporting states remained
the samewith theexceptionofWashingtonmoving to the top
threeandpushingNewYorkout tonumber four.Of the top10
states,NewYork, Florida, andMichiganwere theonly states to
showadecrease inexports.
PetroleumandCoal, Agriculture, andChemicals remain top
Louisianaexport industries. Thevalueof Louisiana’spetroleum
andcoal exports fell by less thanonepercent in2014, totaling
$25.7billion, but remainedLouisiana’s topexport, followedby
Agricultureproducts, andChemicals.
Agricultural productsexperiencedan impressive rebound last
year. In2013Louisianaexportsof agricultural productsde-
creasedby20.3percent from thepreviousyear,while in2014,
exports increasedby14.2percent.OilseedsandGrainsmadeup
the largestpercentageof exportsofAgricultural Products total-
ing$17.7billion.
The largestdecreasewithinLouisiana’s top10 industrieswas
inexportsofMineralsandOres, as thecategory showedanother
yearofdecline fallingby18.9percentover2013.
Louisiana’sexports inPrimaryMetalManufacturing (up46
percent), BeverageandTobaccoProducts (up27.6percent),
FabricatedMetal Products (up24.5percent)andTransportation
Equipment (up18.3percent)all showed strongexport growth
in2014. The top threecountries receivingLouisianaexportsof
PrimaryMetalManufacturinggoodswereChina,Mexico, and
Panama.
Themainexportsunder thecategoryof PrimaryMetalManu-
facturingwereNonferrousMetal (except aluminum), Iron, Steel
andFerroalloy, Alumina, AluminumandProcessing, Foundries,
andSteel Products fromPurchaseSteel. Increasedexports to
Egypt, Colombia, and theNetherlandsLouisianaexports toEgypt
(up79.2percent), Colombia (up48.8percent)and theNeth-
erlands (up22.8percent) showed significant growth in2014,
whencompared to thepreviousyear.
Bycontrast, exports toSingaporedecreasedby43.9percent
in2014, knocking them to the10th largest exportmarket for
Louisiana, fromnumber6 in2013. Louisianaexports toSinga-
pore in2013wereat their largest in the last10years, before
decreasing in2014. The largestdecrease inLouisianaexports to
Singaporecame fromPetroleumandCoal Products; purchases
of this commoditydecreasedby52.7percent in2014. Exportsof
FoodandKindredProducts toSingapore, aswell asComputers
andElectronicProductsalsodiminished.
Louisianaexport growth toEgyptwasprimarilydue to in-
creasedpurchasesof PetroleumandCoal Products (up439.4
percent) in2014,whileexports toColombianotonly increased
in theareasof PetroleumandCoal Productsbut alsoAgricultural
Products,Machinery (except electrical) followedbyTranspor-
tationEquipment. Louisianaexports to theNetherlandsalso
increased substantially in theareasofAgricultural Products,
PrimaryMetalManufacturingandFabricatedMetal Products.
Editor’sNote: Trade dataand charts in this reportwere providedby
theWorldTrade Center ofNewOrleans andWISERTrade.
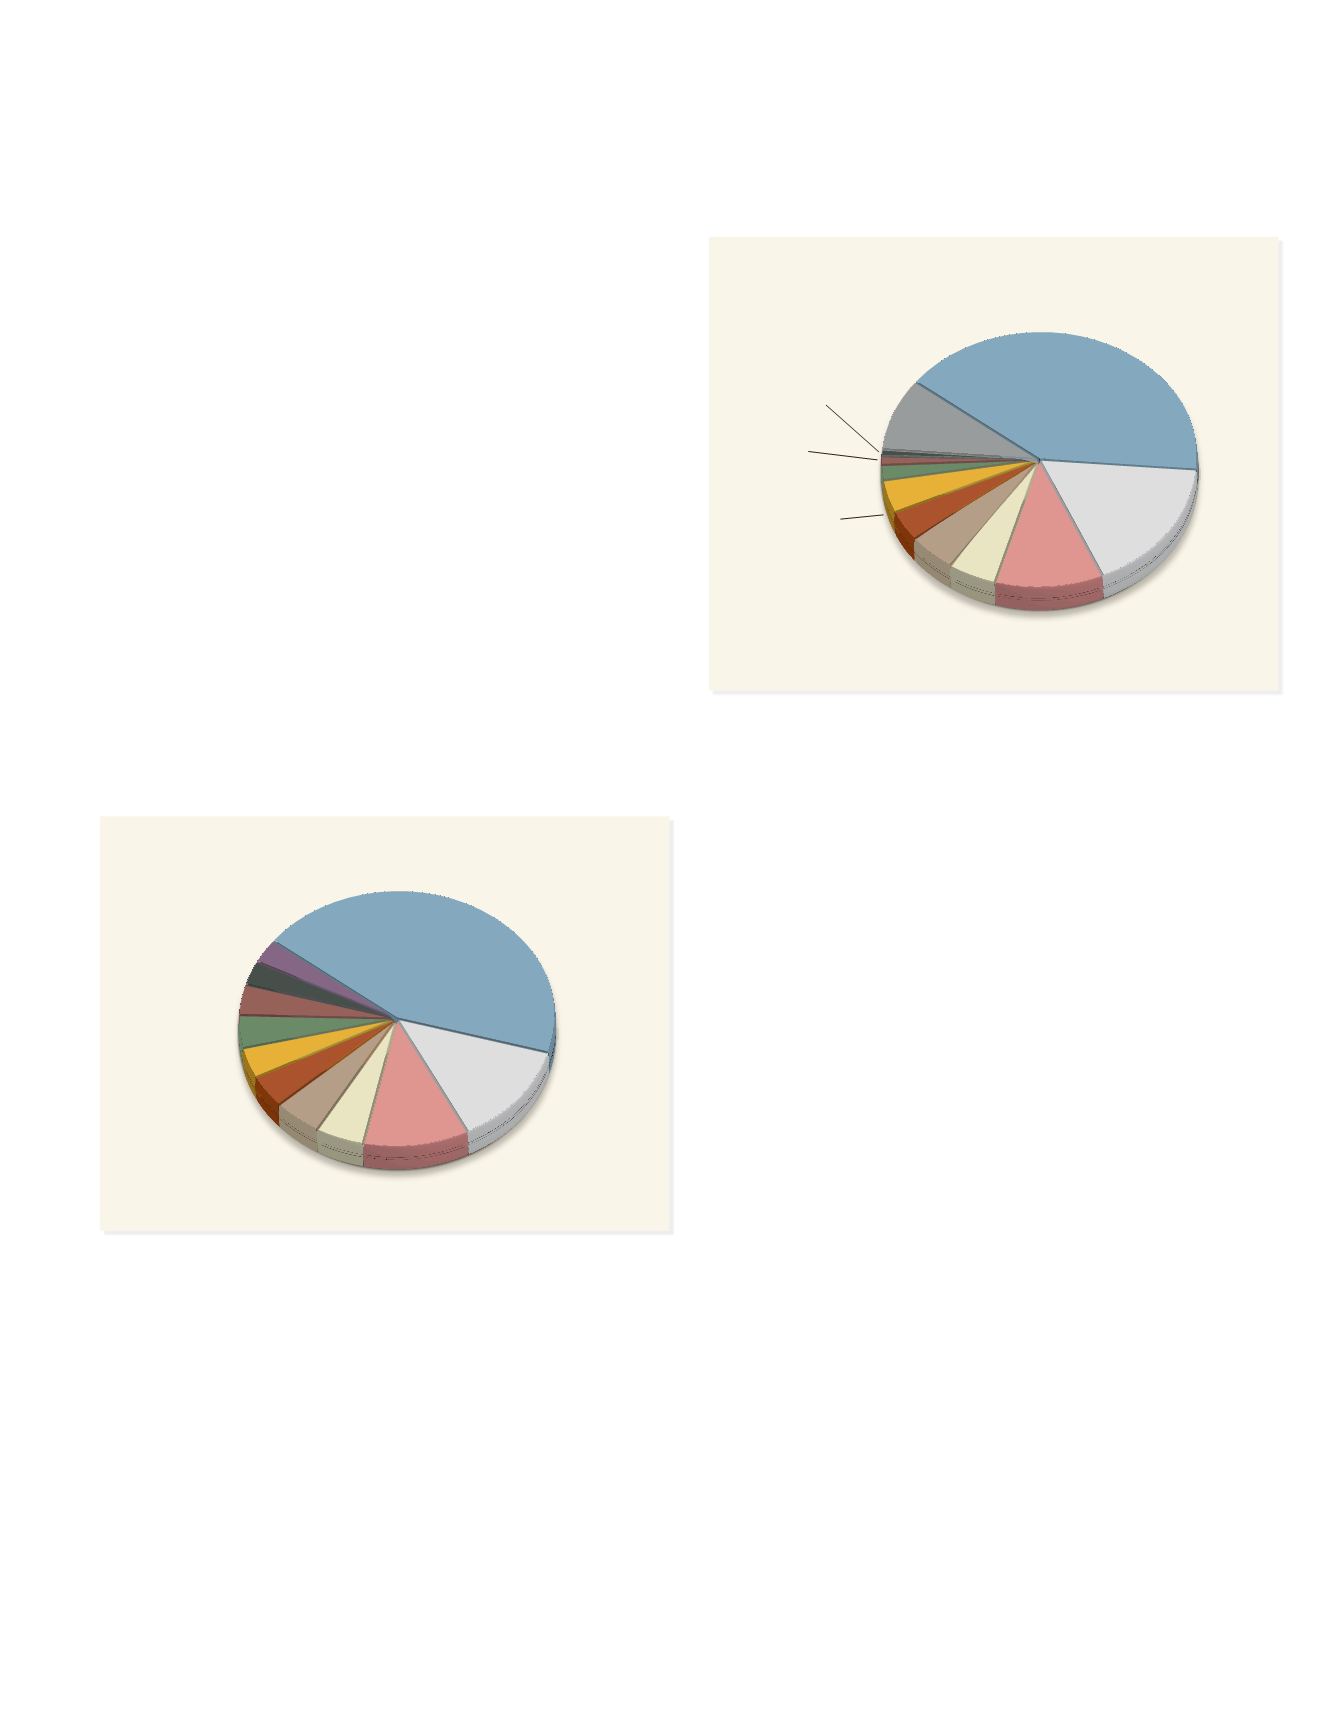
LouisianaExportsTotaledMoreThan$65Billion in2014
Other 44%
Egypt 3%
Columbia 4%
Panama 3%
France 4%
Brazil 4%
Netherlands 5%
Mexico 11%
Japan 4%
China13%
Canada 5%
Rubber 1%
Other 9%
Animal, Vegetable
Fats, Oils 1%
Misc. Chemicals 2%
Industrial Machinery,
Computers 4%
Organic Chemicals 4%
Food IndustryWaste 5%
Plastics 5%
Oil Seeds, etc. 17%
Cereals 11%
Mineral Fuel,
Oil, etc. 41%
Top10LouisianaExportCommodities
Other 44%
Egypt 3%
Columbia 4%
Panama 3%
France 4%
Brazil 4%
Netherlands 5%
Mexico 11%
Japan 4%
China13%
Canada 5%
Rubber 1%
Other 9%
Animal, Vegetable
Fats, Oils 1%
Misc. Chemicals 2%
Industrial Machinery,
Computers 4%
Organic Chemicals 4%
Food IndustryWaste 5%
Plastics 5%
Oil S eds, tc. 17%
Cereals 11%
Mineral Fuel,
Oil, etc. 41%
Top10DestinationCountries for Louisiana’sExports


